
Detecting Forest Degradation with CEO's Geo-Dash
This post was written by Eric Bullock, Stephanie Spera, Yunuen Reygadas Langarica, and Raja Ram Aryal, and was originally featured on the Collect Earth Online website. Click here to go to the original post.
Detecting forest degradation is emerging as a central issue in carbon emissions and forest ecosystem damage. Leading remote sensing experts Eric Bullock of Boston University and team recently stated, “our results suggest that the area of disturbed forest in the Amazon is 44%–60% more than previously realized, indicating an unaccounted-for source of carbon emissions and pervasive damage to forest ecosystems,” in their peer reviewed article in Global Change Biology (Bullock et al., 2020).
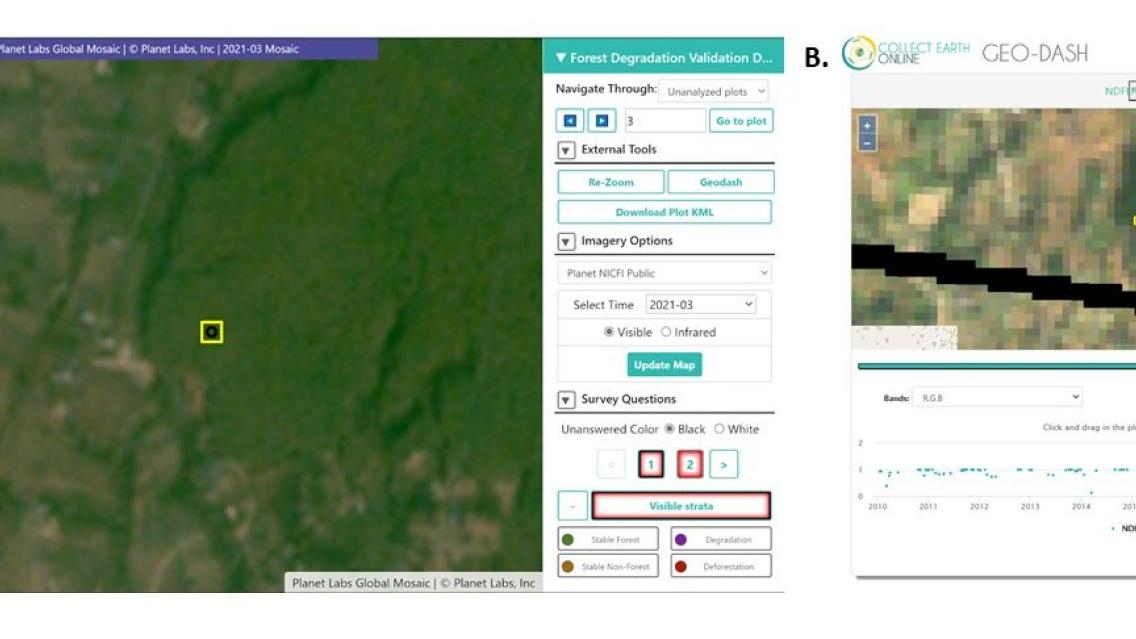
Users of Collect Earth Online (CEO) around the world are taking advantage of a CEO feature called the Geo-Dash Degradation Tool that allows them to monitor forest degradation, a major source of carbon emissions. CEO provides an intuitive, web-based data collection interface that enables multiple users to contribute to labeling the landscape, including for forest degradation monitoring purposes.
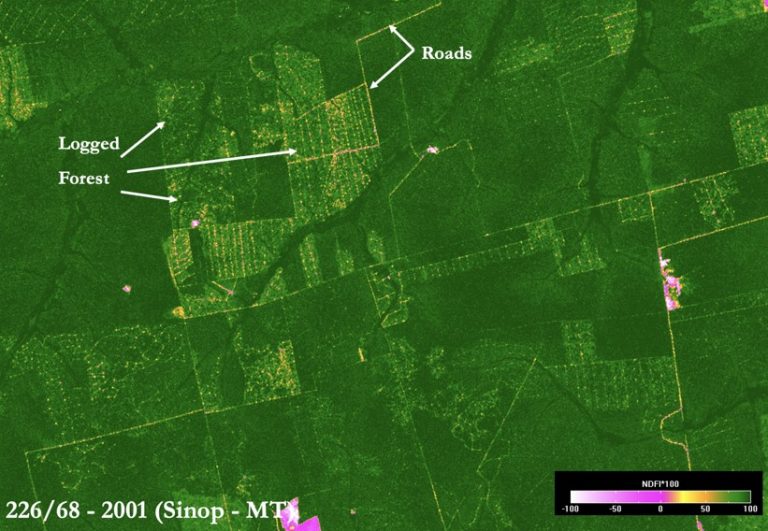
This illustration of NDFI as an aid to landscape interpretation (here, selective logging) shows intact forest as dark green, forest disturbance
in orange-yellow, deforestation in magenta, and bare soil in white. Figure from Souza et al., 2005
CEO’s Geo-Dash Degradation Tool helps users confirm and verify cases of forest degradation, or temporary change in tree canopy cover. It does so by combining the Normalized Difference Fraction Index (NDFI) with a time series of Landsat and Sentinel imagery, allowing the user to detect changes in the forest canopy over time, even subtle and short-lived changes (Souza et al., 2005; Remote Sensing of Environment). The Degradation Tool leverages Google Earth Engine to make this information available to users.
What is forest degradation and why is it so hard to monitor?
There are many definitions of forest degradation, but most simply we think of it as a non-permanent change in tree canopy cover.
Forest degradation varies in severity, depending on the cause of the disturbance. Some involve loss of all tree canopy and take a considerable time to regrow, such as when trees are lost in forest fires. Others involve smaller changes after which the area quickly recovers, such as with selective logging. The defining characteristic is that the area eventually re-establishes intact forest cover. Deforestation, by contrast, refers to more permanent loss of forest canopy and conversion to other land uses such as agriculture.
Degradation is often detected in remote sensing by observing a temporary change in the level of greenness that is indicative of tree cover. This is often measured using an index that mathematically combines different parts of the light spectrum into a single value, such as NDFI. NDFI expresses what portion of a plot of land is covered by green vegetation as opposed to bare soil or non-photosynthetic (i.e., dead or dormant) vegetation.
Detecting forest degradation can be difficult because the spatial scale is often small and the time when degradation is detectable using remote sensing imagery is short (usually within one year). It is also challenging in areas with persistent cloud cover.
That’s why it’s critical to have access to tools designed specifically to highlight the subtle signal of forest degradation in remotely sensed images.
The CEO Degradation Tool combines a time series plot of spectral indices such as NDFI along with an imagery viewing window, providing a user-friendly tool to aid in detecting forest degradation. By combining this index with a series of images, users can detect even relatively minor changes in vegetation and estimate when those changes occur.
Having a time series plot of spectral indices and images also helps avoid confusion between seasonal vegetation patterns and forest degradation. For example, you would expect deciduous forests to show a high proportion of non-photosynthetic vegetation in winter, after the leaves have fallen. If a similar signal appears during the summer, however, it more likely indicates forest degradation. Forests with rainy and dry seasons would show similar patterns, showing more non-photosynthetic vegetation, including burned forests, during the dry season. In contrast, in an evergreen forest with few seasonal vegetation patterns, a change in vegetation at any point of the year could indicate degradation.
Leveraging the Degradation Tool
Multiple teams around the world, including in Nepal, Lao PDR, Peru, Afghanistan, and Bangladesh, are leveraging the Degradation Tool in CEO’s Geo-Dash to better understand the status of their forests and manage these same forests. This easy-to-use tool allows decision-makers to monitor degradation hotspots and understand how degradation is contributing to carbon emissions. It also allows them to track potential unintended consequences of sustainable development initiatives.
Often, teams use the Degradation Tool in conjunction with the high-resolution time-stamped imagery from Planet available through Norway’s International Climate & Forests Initiative (NICFI) initiative. Users can leverage the high-resolution imagery to confirm when the disturbance occurred.
Nepal (SilvaCarbon, World Bank)
Researchers in Nepal are using the CEO degradation widget to inventory forest degradation and assess the associated greenhouse gas emissions. This work is part of an initiative to evaluate various approaches to monitoring, reporting, and validation (MRV) efforts in support of the World Bank’s Forest Carbon Partnership Facility (FCPF) payments.

