
Use Case: Kenya Ministry of Agriculture, Livestock, Fisheries, and Cooperatives (MoALFC)
User: Kenya’s Ministry of Agriculture, Livestock, Fisheries, and Cooperatives (MoALFC)
SERVIR Hub: SERVIR-Eastern and Southern Africa
Geographic Location: Kenya
User Background: Kenya’s Ministry of Agriculture, Livestock, Fisheries, and Cooperatives (MoALFC) aims to increase agricultural and food productivity and outputs to ensure national food security. MoALFC strives to transform these sectors to be competitive, commercially oriented and responsive to the economic needs of the country. The Ministry utilizes digital food balance sheets, which helps to track food production and provides decision-makers with critical information.
Service Summary: The Regional Cropland Assessment and Monitoring Service seeks to provide timely information for food security assessments through the development of national and regional crop monitors in East Africa. The crop monitors are helping streamline data collection and synthesize crop conditions through a combination of field assessments and earth observation data. Information about crop conditions is supplemented with climate outlook and market information. The resulting maps provide an understanding of crop conditions and drivers of less than favorable conditions. The service facilitates a crop modeling framework to assess drought and yields estimates using CHIRPS data for precipitation estimates and crop type maps derived from Landsat and Sentinel. Additional activities include supporting the Kenya Government crop insurance program by developing a geospatially informed sampling frame. The sampling frame has resulted in over 70% cost reduction and reduced sampling time - increasing efficiency and reducing bias in sample selection. Overall, the service supports enhanced food security decisions from the local to regional levels.
The Regional Hydrologic Extremes Assessment System (RHEAS) model is a NASA-supported, open-source software framework. It links the Variable Infiltration Capacity (VIC) hydrologic model and the Decision Support System for Agrotechnology Transfer (DSSAT) crop model.
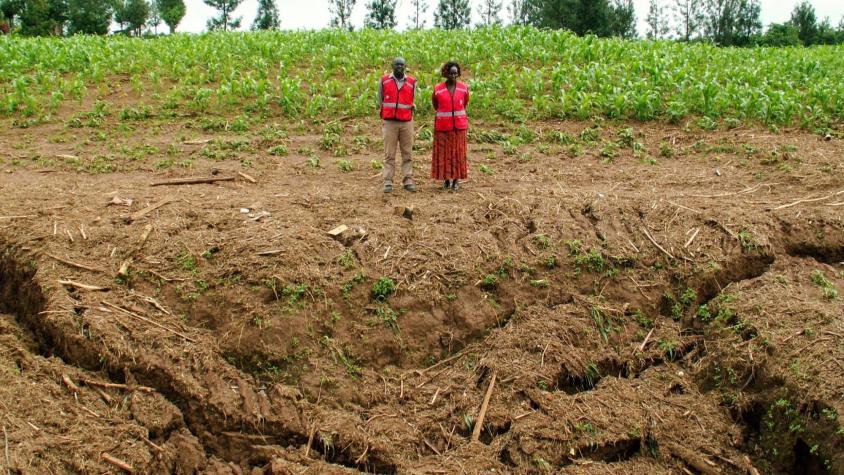
Situation: Drought and floods are two major climatic factors that endanger food security in Kenya. About 40% of Kenya’s population is employed in the agriculture sector, and in many regions farms are rainfed. There are two main rainy seasons during which crops are grown: the long rains (March–June) and the short rains (October–December). Increasingly variable rainfall due to climate change exacerbates food insecurity (Kabubo-Mariara and Kabara, 2018; Mumo et al., 2018; Omoyo et al., 2015). Monitoring crop conditions through traditional crop cuts is difficult since they are conducted after the growing season ends. This approach does not allow time for preparation if there is an event that decreases yields over the season. Crop cuts can also be based on small sample sizes which may not be reflective of conditions over a broader region, such as a county. Furthermore, between 2020 and 2021, COVID-19 has made ground-based monitoring more difficult, limiting the possibilities for travel and social interactions, which are needed for field measurements.
User Need: Prior to MoALFC using the Regional Cropland Assessment and Monitoring Service, crop cuts were used to gather yield information. Crop cuts can be expensive and time consuming, thus estimates may be poor or not representative of the entire region. They also take place during harvest, and do not provide information for decision makers during the growing season. This service addressed the need for intra-season yield estimation, which allows more time for the government to prepare if yield estimates reach critical levels.
User Quote:
"During the pandemic period, the country experienced flooding in various parts of the country and the worst hit areas were around Lake Victoria and major rivers where there are low lying farming land and homesteads…It was important for the ministry to know the location of food commodities and volumes in the event that the situation would have deteriorated to the extent of requiring state intervention."
– A report from Tom Dienya and Jane Kioko, heads of the Agricultural Statistics Unit in Kenya’s Ministry of Agriculture, Livestock, Fisheries, & Cooperatives (MoALFC)
Example of Use: The SERVIR-Eastern & Southern Africa (E&SA) hub, located at the Regional Centre for Mapping of Resources for Development (RCMRD) in Nairobi, is supporting Kenya’s Ministry of Agriculture, Livestock, Fisheries, and Cooperatives (MoALFC) and its Digital Food Balance Sheet by providing maize yield estimates and seasonal forecasts.
SERVIR’s Regional Hydrologic Extremes Assessment System (RHEAS) pairs a spatially distributed hydrologic and biophysical crop modeling framework (illustrated in Figure 1) to provide forecasts of crop conditions in the near future and estimates of past season yields. The hydrologic model used is the Variable Infiltration Capacity (VIC) model and the crop yield estimation is conducted through the Decision Support System for Agrotechnology Transfer (DSSAT).
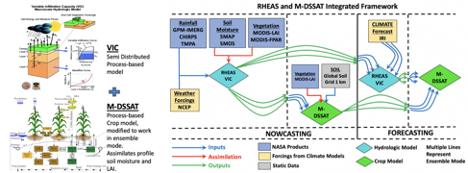
Figure 1. RHEAS schematic showing model inputs, assimilation options, and outputs for the hydrologic model VIC and crop model DSSAT.
Forecasts throughout the growing seasons are made using CHIRPS precipitation and NCEP temperature and wind data up until the latest data available. NMME precipitation and temperature forecasts are then used for the rest of the growing season. The results from the hydrologic assessment is fed into the crop model, which takes the combined information to quantify county level yields at the end of the season. Figure 2 illustrates the manner in which results are made available on SERVIR’s RHEAS Viewer online visualization platform.
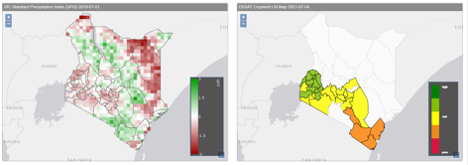
Figure 2. Example of RHEAS outputs on the visualization platform: the left map shows the standardized precipitation index for a selected day, with drier than average areas shown in red to wetter than average shown in green. The right map shows the leaf area index over agricultural counties for a selected day.
If more historical yield data were obtained, the DSSAT model could be further calibrated, remotely sensed leaf area index and soil moisture could be assimilated into the crop model, and the seasonal precipitation forecasts could be bias-corrected – with the intention to help East Africa obtain more accurate forecasts earlier in the season.
RHEAS enhances traditional field monitoring, especially in areas that are difficult to access or where field observations are sparse. Forecasts are made twice monthly throughout the growing seasons as data inputs to the model (current conditions and seasonal forecast) are updated. Uncertainties in yield forecasts are larger early in the season, as seasonal weather forecasts tend to overestimate rainfall frequency and underestimate intensity. The yield forecasts become more reliable close to the end of the season as more observed weather data replaces the forecasted precipitation, as shown in Figure 3. Even forecasts close to the end of the season provide yield estimates before measured yields become available, giving decision makers more time to prepare if below-average yields are projected.
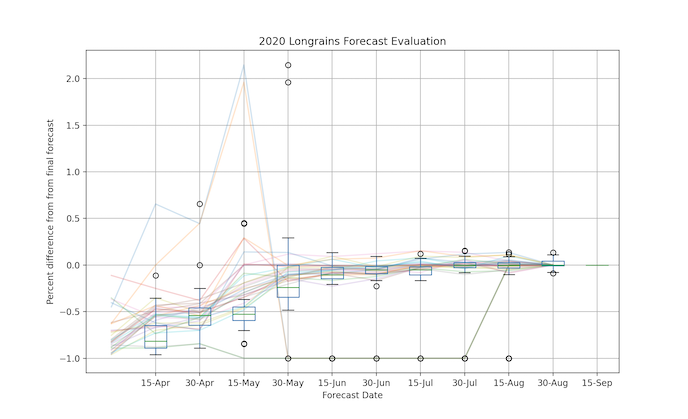
Figure 3. Ensemble crop yield uncertainty from RHEAS shows reduction as the crop season progresses and new observations become available. At the beginning of the season, the yield forecasts are much lower and have higher variability, which are indicated by the large blue boxes. As the season progresses and more observed weather data becomes available, the blue boxes become smaller, indicating less uncertainty in yield estimates.
Outcome of Use: This information enables Kenya’s Ministry of Agriculture, Livestock, Fisheries, and Cooperatives (MoALFC) to focus on areas where financial and food aid are needed, and helps the country to prepare for potential food security threats.
At the formal request of the Permanent Secretary (PS), and as part of the national COVID-19 Committee, the data provided by SERVIR-E&SA was used to help the PS develop actionable information on expected production and coping mechanisms, as well as to assess impacts of COVID-19 impacts on the national food security. SERVIR-E&SA’s data is used to inform advisories for farmers, market traders and other value chain actors.
The maize yield and total production estimates and forecasts, provided as an input to the Digital Food Balance Sheet, were also used to monitor projections for food demand and supply throughout the long rainy season and the COVID-19 emergencies.
Future Collaborations: There is potential for future collaboration between MoALFC and SERVIR-E&SA, as the Regional Cropland Assessment and Monitoring Service will be enhanced as further improvements to the model are made. The service is also currently expanding to more countries in the region, including Ethiopia, Kenya, Rwanda, Tanzania, and Uganda, and collaborations with government agricultural ministries in these countries will be likely as the expansion progresses.
Additional Documents:
- https://journals.plos.org/plosone/article?id=10.1371/journal.pone.0176506
- Tropical Rainfall Measuring Mission Multi-satellite Precipitation Analysis version 7: SSMI, SSMIS, MHS, AMSU-B and AMSR-E, IMERG (Huffman et al., 2007)
- Funk, C., Peterson, P., Landsfeld, M., Pedreros, D., Verdin, J., Shukla, S., and Michaelsen, J. (2015). The climate hazards infrared precipitation with stations—a new environmental record for monitoring extremes. Scientific data, 2(1), 1-21.
- Huffman, G. J., Bolvin, D. T., Nelkin, E. J., Wolff, D. B., Adler, R. F., Gu, G., and Stocker, E. F. (2007). The TRMM Multisatellite Precipitation Analysis (TMPA): Quasi-global, multiyear, combined-sensor precipitation estimates at fine scales. Journal of hydrometeorology, 8(1), 38-55.
- Kabubo-Mariara, J.,and Kabara, M. (2018). Climate change and food security in Kenya (pp. 55-80). Routledge.
- Kalnay, E., Kanamitsu, M., Kistler, R., Collins, W., Deaven, D., Gandin, L., and Joseph, D. (1996). The NCEP/ NCAR 40-year reanalysis project. Bulletin of the American Meteorological Society, 77(3), 437-472.
- Mumo, L., Yu, J., and Fang, K. (2018). Assessing impacts of seasonal climate variability on maize yield in Kenya. International Journal of Plant Production, 12(4), 297-307.
- Omoyo, N. N., Wakhungu, J., and Oteng’i, S. (2015). Effects of climate variability on maize yield in the arid and semi-arid lands of lower eastern Kenya. Agriculture & Food Security, 4(1), 1-13.
- SERVIR. (n.d.). ClimateSERV. Retrieved August 13, 2021, from http://servirglobal.net/services/climateserv