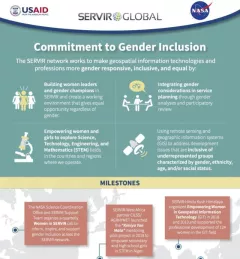
Infographic Commitment to Gender Inclusion Learn more about how the SERVIR network works to make geospatial information technologies and professions more gender responsive and inclusive. November 27, 2019
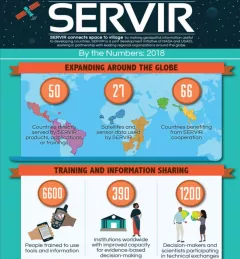
Infographic SERVIR by the Numbers: 2018 SERVIR by the Numbers 2018 provides a visual glance of SERVIR's work up through 2018. April 23, 2019
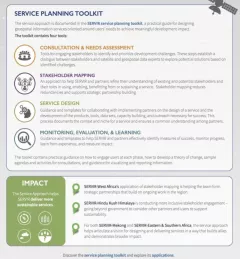
Infographic SERVIR's Service Approach SERIR uses a "service" approach to identifying and addressing climate challenges. April 17, 2019
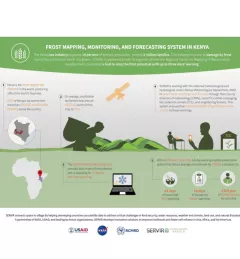
Infographic Frost Monitoring in Kenya The Kenya tea industry supports 10 percent of Kenya's population, around 3 million families. The industry is prone to damage by frost due to the altitudes in which it is grown. January 16, 2019