
Flood Inundation and Flood Occurrence Mapping
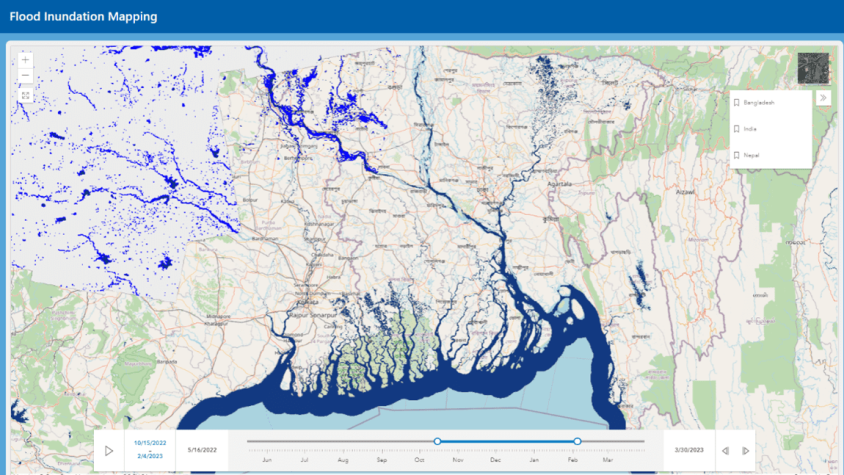
Floods are a recurring event in the HKH region. Every year during the monsoon the region is inundated by floods causing massive damages to infrastructure, crops, and impacting millions of people. SERVIR HKH and University of Alaska Fairbanks, along with regional and national level partners have developed the methodology and workflow for inundation extent and flood depth mapping. Through this collaboration they developed the Flood Inundation Mapping Tool, a cloud-based system developed to map flood areas in Bhutan, Bangladesh, Nepal, and the northeast part of India.
The system uses Sentinel-1 SAR data to capture flood events. The flood information is available within hours after data acquisition and can provide near real-time information on flood water extent and flood depth. Because the SAR data can penetrate clouds, the system is useful for monsoon dominated areas that are mostly covered by clouds. The system uses Height Above the Nearest Drainage (HAND) data derived from the Digital Elevation Model (DEM) to estimate flood depth of an area. The flood extent and depth information is available every 8-12 days with horizontal resolution of 30m and vertical resolution of 1m. The product workflow is automated in a cloud-based platform and distributed through an image server. This service provides critical flood occurrence and depth information to urban planners for mitigation efforts as well as disaster managers key in aiding the reduction of exposure of vulnerable communities.
Rationale
During floods, the information on the affected area and flood depth is critical for response planning. Disaster managers often struggle to prioritize resource allocation and rescue operations due to the lack of accurate information on the extent and depth of flooding. Allocation of funds by government and donor agencies are also dependent on the understanding of the scale of the hazard and population at risk. In this context, near real-time mapping of flood extent would provide very useful information for response planning and damage assessment. In addition, mapping the region to identify areas that are consistently flooded could provide vital information to decision makers. Based on the information, decision makers can plan their activities on where flood mitigation measures are required and improve the disaster preparedness efforts.
-
Users
Department of Hydrology and Meteorology (DHM), Nepal
Practical Action, Nepal
Nepal Red Cross Society
National Disaster Risk Reduction And Management Authority (NDRRMA), Nepal
Flood Forecasting and Warning Centre, Bangladesh
Bangladesh Water Development Board
National Center for Hydrology and Meteorology (NCHM), Bhutan